How to Backtest a Trading Strategy Without Coding (2026 Guide)
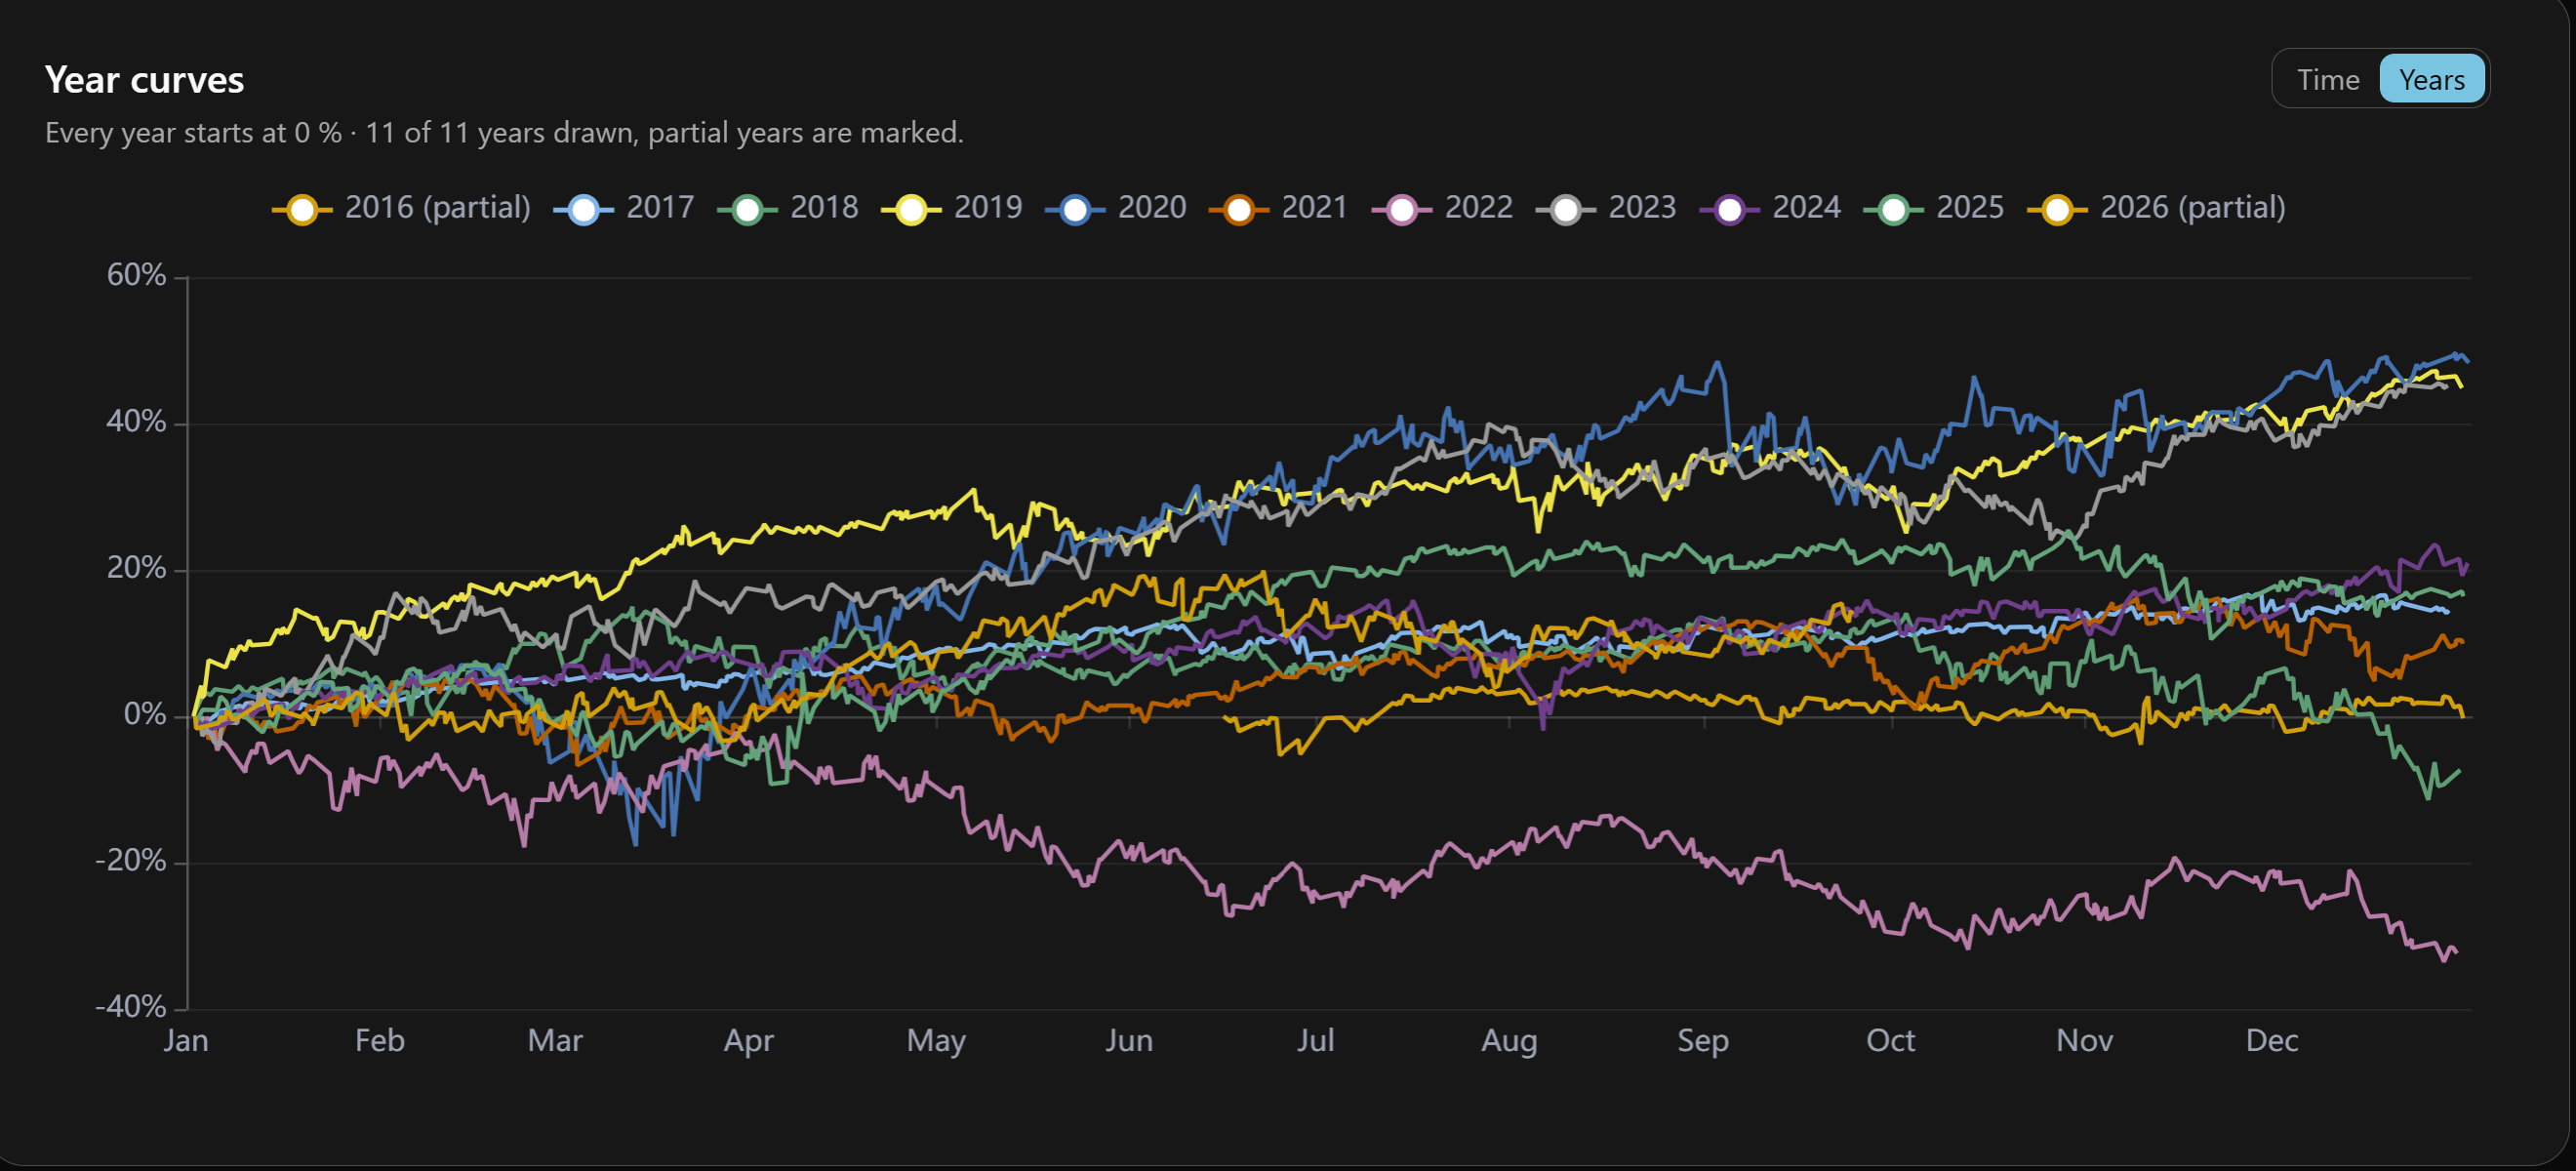
How to Backtest a Trading Strategy Without Coding (2026 Guide)
Backtesting is one of the most useful ways to evaluate a trading idea before risking real money. But for many traders, it still means spending hours on historical charts, replaying candles one by one, and recording hypothetical trades in a spreadsheet.
That approach can work, especially when learning discretionary trading. But it becomes increasingly time consuming when you want to test hundreds of trades, compare different markets, or evaluate a strategy across several years.
The alternative is automated backtesting.
Instead of manually finding every setup, you define your trading rules once and let a backtesting engine evaluate them against historical market data. And with modern visual strategy builders, you no longer need to know Python or Pine Script to do it.
This guide explains how to build a reliable backtesting process, from defining a strategy to evaluating its results and checking whether its apparent edge survives more demanding tests.
What Is Backtesting in Trading?
Backtesting is the process of applying a trading strategy to historical market data to simulate how it would have performed.
A backtest attempts to reconstruct the decisions a strategy would have made using the information available at each point in time.
For example, suppose you want to investigate whether breakouts above the previous day's high tend to continue during the New York session.
A backtest would identify the previous day's high, detect qualifying breakouts, simulate entries and exits, and calculate the resulting performance across the selected historical period.
Rather than relying on a few examples that look convincing on a chart, you can evaluate every occurrence that meets your predefined conditions.
The goal is not to prove that a strategy will be profitable in the future. It is to understand how the strategy behaved historically, what risks it experienced, and whether the evidence justifies further investigation.
Manual Backtesting vs. Automated Backtesting
Manual backtesting typically involves using a chart replay feature, such as TradingView's Bar Replay, to move through historical candles and identify trading opportunities.
It can be useful for practicing discretionary setups, understanding price action, and developing trading intuition.
However, the results depend on how consistently the trader interprets each setup. Reviewing large historical datasets can also take considerable time.
Automated backtesting works differently. You translate your strategy into objective rules, and software evaluates those rules across the historical data.
For instance, instead of manually checking every time the RSI crosses above 30 while price trades above a long term moving average, a backtesting engine can identify those conditions automatically.
The distinction matters because automated testing is not simply faster chart replay. It is a different research process built around explicit, reproducible rules.
Neither approach is universally better. Manual replay remains valuable for discretionary training, while automated testing is particularly useful for systematic strategies and larger historical samples.
Step 1: Define Exactly What You Want to Test
A reliable backtest begins with a clearly defined hypothesis.
Many trading strategies are initially described in subjective language.
You might hear that a market is bullish, that price has entered a strong demand zone, or that a breakout has enough momentum to continue.
These descriptions may make sense to an experienced trader, but they are not precise enough for an automated backtest.
The first task is to translate the idea into conditions that can be evaluated consistently.
Consider a liquidity sweep strategy.
You might believe that EUR/USD frequently reverses after trading below the previous day's low during the London session.
To test that hypothesis, you need to define exactly what qualifies as a liquidity sweep.
Does price simply need to trade below the previous day's low? Must it close back above that level? Does the reversal need to occur within a certain number of candles?
You also need to specify the trading session, entry timing, stop loss, and exit conditions.
These details are not minor implementation decisions. They determine which trades the strategy takes.
Two traders can claim to trade the same liquidity sweep strategy while using rules that generate completely different results.
Separate the Hypothesis From the Implementation
It helps to distinguish between the idea you're investigating and the exact rules used to test it.
The hypothesis might be that liquidity sweeps are followed by short term reversals.
One implementation could require a candle to close back inside the previous day's range. Another could require an additional market structure confirmation.
Both investigate related ideas, but they are different strategies.
This distinction becomes important later when interpreting the results.
A profitable backtest of one particular implementation does not establish that every variation of the underlying concept works.
Define the Complete Trade Lifecycle
Before building your strategy, make sure the rules describe more than just an entry signal.
You need to know when a trade can open, how its position size is calculated, where its protective stop is placed, and under what conditions it closes.
You should also decide whether multiple positions can be open simultaneously, whether a new signal can occur while a trade is active, and how conflicting entry and exit conditions are handled.
A strategy with a well defined entry but ambiguous exit rules cannot be evaluated consistently.
Step 2: Turn Your Rules Into an Automated Strategy
Once the rules are clear, they need to be translated into a form that a backtesting engine can execute.
Traditionally, this meant writing code.
A trader might use Pine Script to implement a strategy in TradingView or Python to build a custom testing environment.
These approaches provide flexibility, but they also require programming knowledge and additional work to handle historical data, execution logic, and performance calculations.
A visual strategy builder removes much of that technical barrier.
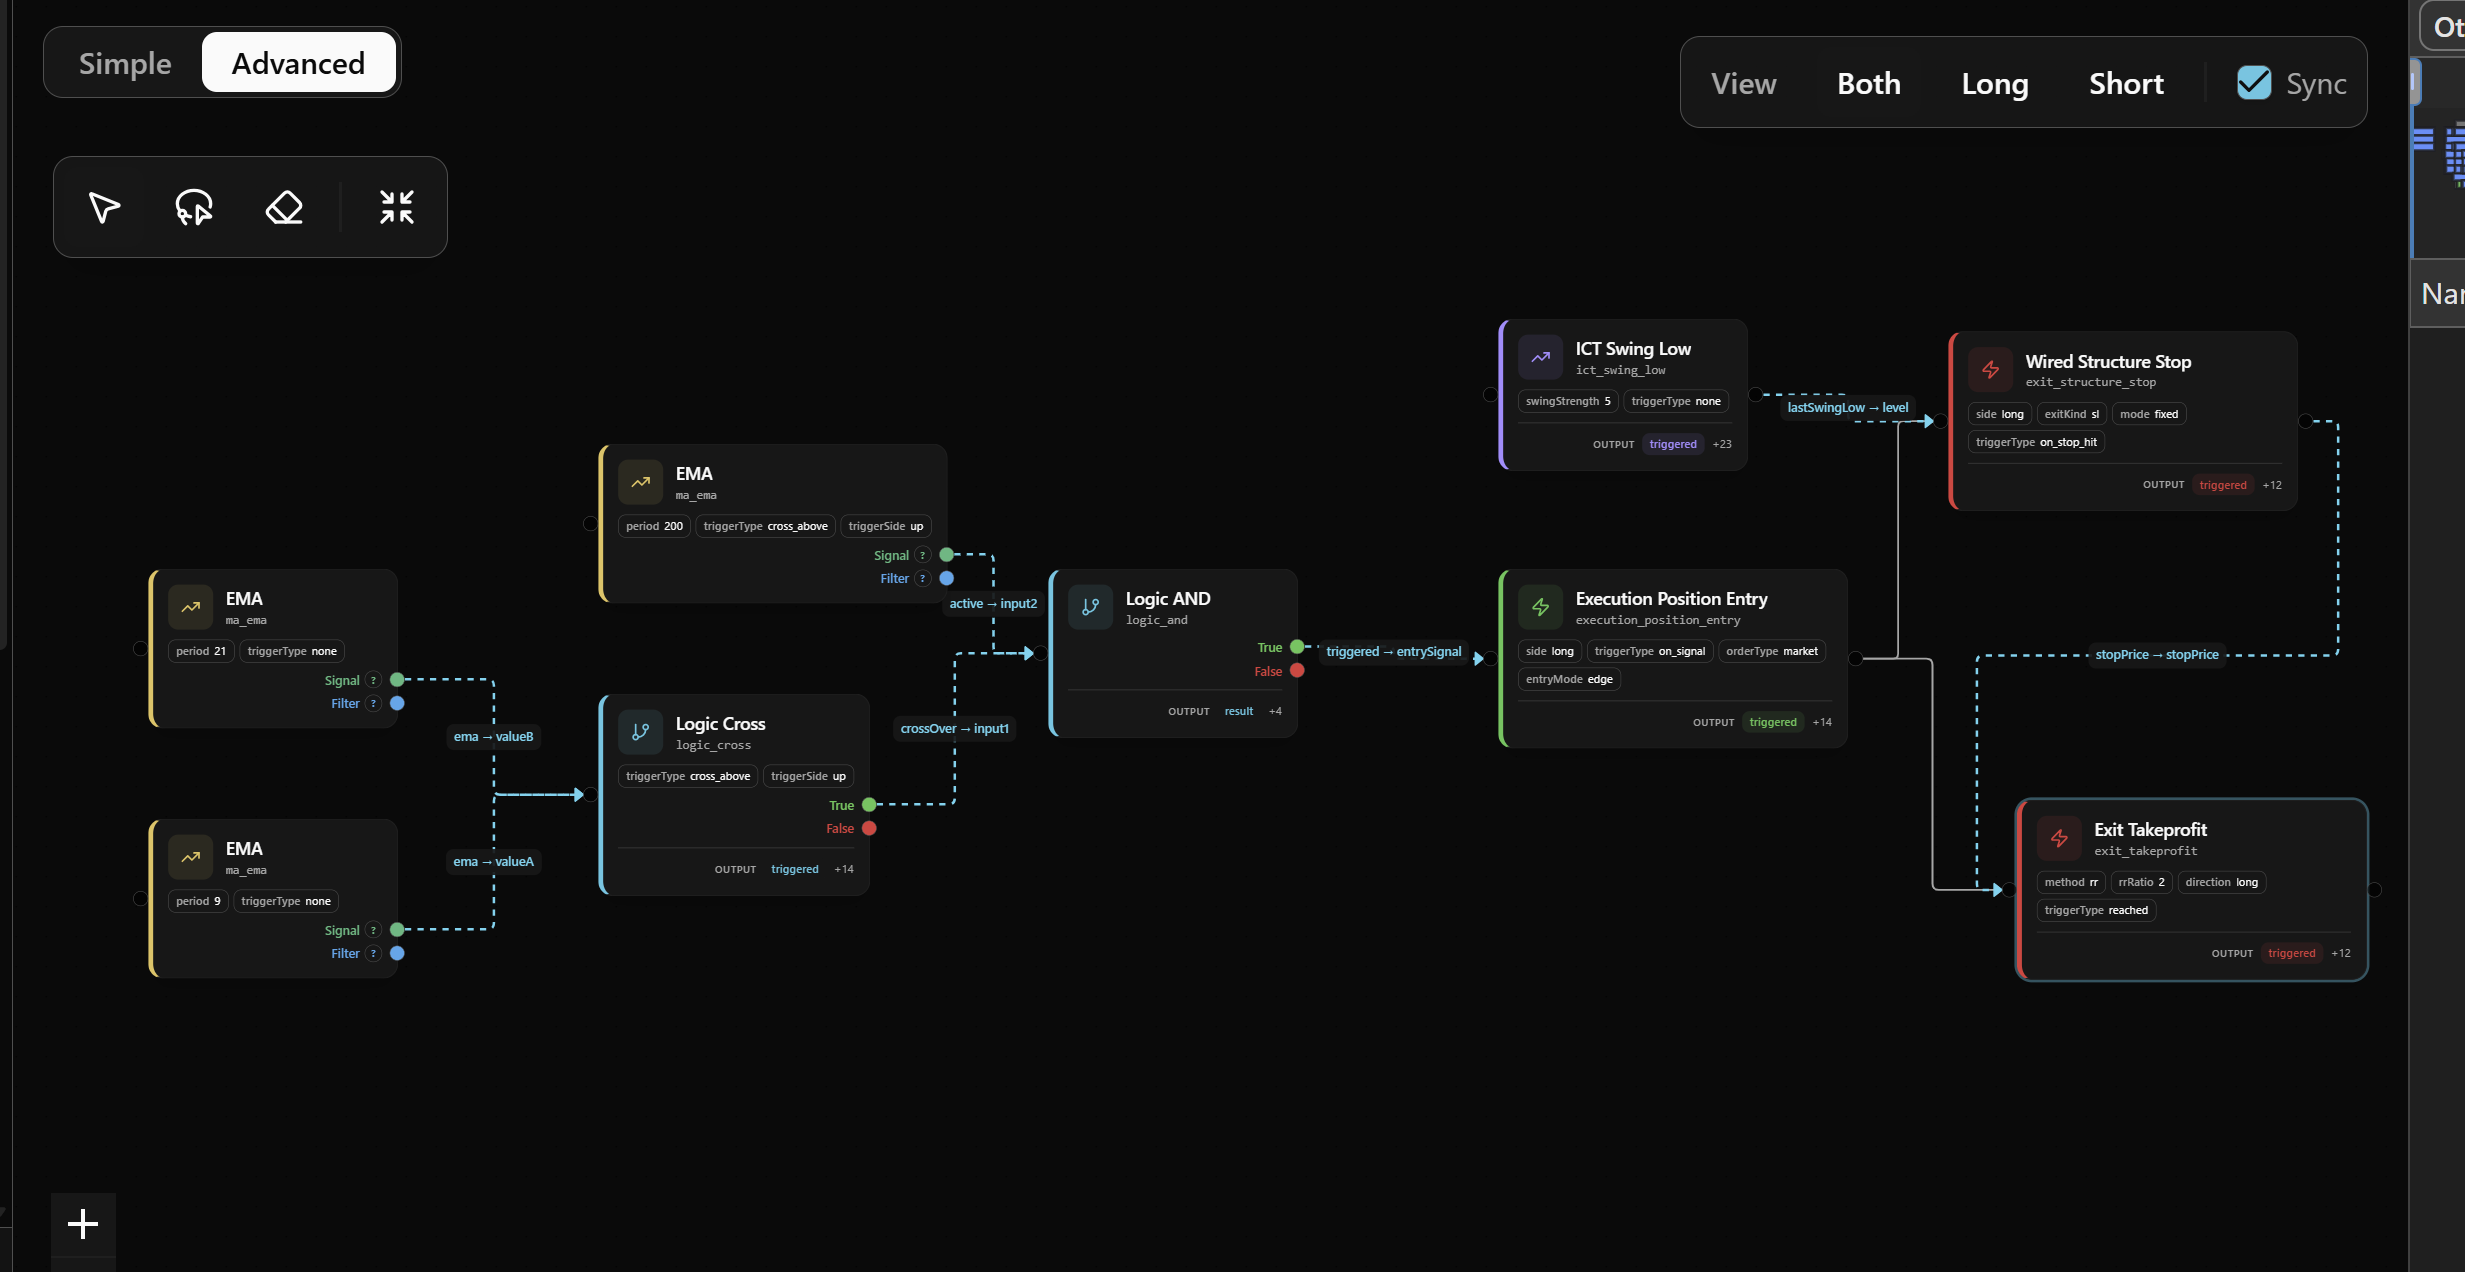
With Algovex, traders can create rule based trading algorithms without writing code.
The platform offers a Simple Builder for more straightforward strategies and an Advanced Graph for more complex logic.
For example, suppose you're investigating a volatility breakout strategy.
Your hypothesis is that a period of low volatility followed by an expansion in price movement may lead to directional continuation.
You could define a period of relatively low volatility using the Average True Range, then require price to break above the highest high of a preceding lookback window.
The strategy might also include a higher timeframe trend filter and a stop loss calculated from the current ATR.
In a visual builder, supported indicators, comparisons, conditions, and trading operations can be combined to represent this logic.
The resulting strategy is not just a visual diagram. It defines the conditions the backtesting engine evaluates.
Practical Example: Backtest a Simple RSI Strategy Without Coding
Let's look at a simple example of how a trading idea can be converted into testable rules.
Suppose you want to investigate whether EUR/USD tends to recover after entering oversold conditions.
You could start with the following strategy:
Market: EUR/USD
Timeframe: 1 hour
Indicator: RSI (14)
Entry condition: RSI crosses back above 30
Exit condition: RSI crosses above 50
Risk management: A predefined stop loss
Testing period: Multiple years of historical data
These rules are deliberately simple. The objective is not to suggest that this strategy is profitable, but to demonstrate how a trading hypothesis can be tested systematically.
Using a visual strategy builder such as Algovex, you can translate these conditions into trading rules without writing Python or Pine Script.
Once configured, the backtesting engine can evaluate historical signals and simulate the resulting trades.
You can then inspect the individual entries and exits, review the equity curve, and examine performance metrics such as win rate, profit factor, and maximum drawdown.
If the results appear promising, the next step is to test whether they remain consistent across different periods and market conditions.
The key advantage of no-code backtesting is not that it makes a strategy profitable. It makes testing and evaluating your ideas more accessible.
Simple Builder or Advanced Graph?
For strategies with a relatively small number of conditions, a structured builder is often sufficient.
More complex strategies may require several layers of logic, mathematical calculations, or interactions between different timeframes.
A graph based editor makes those relationships easier to express and inspect.
The important consideration is whether the trading idea can be represented precisely using the available operations and data.
Some discretionary strategies depend on subjective judgment that cannot easily be translated into objective rules.
In those cases, automated backtesting may require simplifying or redefining parts of the original approach.
That limitation should be acknowledged rather than hidden.
Step 3: Choose the Right Historical Data
A backtest can only be as reliable as the data and assumptions behind it.
Before running a strategy, select the instrument, timeframe, and historical period you want to evaluate.
The appropriate dataset depends heavily on the type of strategy.
A daily trend following system may require many years of historical data to capture different market cycles.
An intraday strategy targeting small price movements may require detailed historical data and more precise execution assumptions.
Algovex supports historical backtesting with up to 25 years of data, depending on the instrument and available coverage.
However, having more historical data does not automatically produce a better backtest.
The data needs to be appropriate for the strategy.
Historical Coverage and Market Conditions
Suppose you're testing a mean reversion strategy on a major currency pair.
If your historical period contains mostly stable, ranging markets, the strategy may appear more reliable than it actually is.
A longer test that includes strong trends, volatile periods, and changing monetary conditions may reveal weaknesses that weren't visible in the original sample.
The objective is to evaluate a strategy across conditions relevant to its intended use, not simply to maximize the number of years displayed in the report.
Data Quality and Timeframes
Historical data may contain missing observations, incorrect prices, or inconsistencies between data providers.
For intraday strategies, session boundaries and timezone handling are especially important.
An opening range breakout strategy, for example, depends on the exact time at which the opening range begins and ends.
If the session definition is incorrect, the strategy may generate trades that do not correspond to the intended market setup.
Trading Costs and Execution Assumptions
Backtests should also account for relevant trading costs.
Spread, commissions, and slippage can significantly change the profitability of a strategy.
This is particularly important for short term systems that target small price movements.
A strategy that earns an average of three pips per trade before costs may behave very differently after realistic execution expenses are included.
You should also understand when the backtesting engine evaluates signals and how simulated orders are filled.
A strategy that generates signals at candle close should not automatically be assumed to execute at an earlier price within the same candle.
Execution assumptions need to reflect what would realistically have been possible.
Step 4: Run the Backtest and Verify the Trades
Once the strategy, historical data, and execution assumptions are configured, you can run the backtest.
The engine evaluates the strategy's conditions across the selected historical period and simulates the resulting trades.
Depending on the complexity of the strategy and the amount of data, this may involve evaluating thousands or millions of historical observations.
But completing the calculation is only the beginning.
Before interpreting profitability, verify that the strategy actually behaves as intended.
Why Reviewing Individual Trades Matters
Imagine testing an opening range breakout strategy.
The results look promising, but when you inspect the trades, you discover that some entries occurred before the opening range had been fully established.
That would indicate a problem with the strategy definition or implementation.
Similarly, a strategy based on a confirmed market structure shift should not enter before the confirmation is available.
Algovex allows traders to inspect simulated trades directly on the chart, making it possible to compare the generated entries and exits with the underlying price action.
This is particularly useful when working with more complex strategies.
A backtest can produce mathematically consistent performance statistics while still evaluating the wrong trading logic.
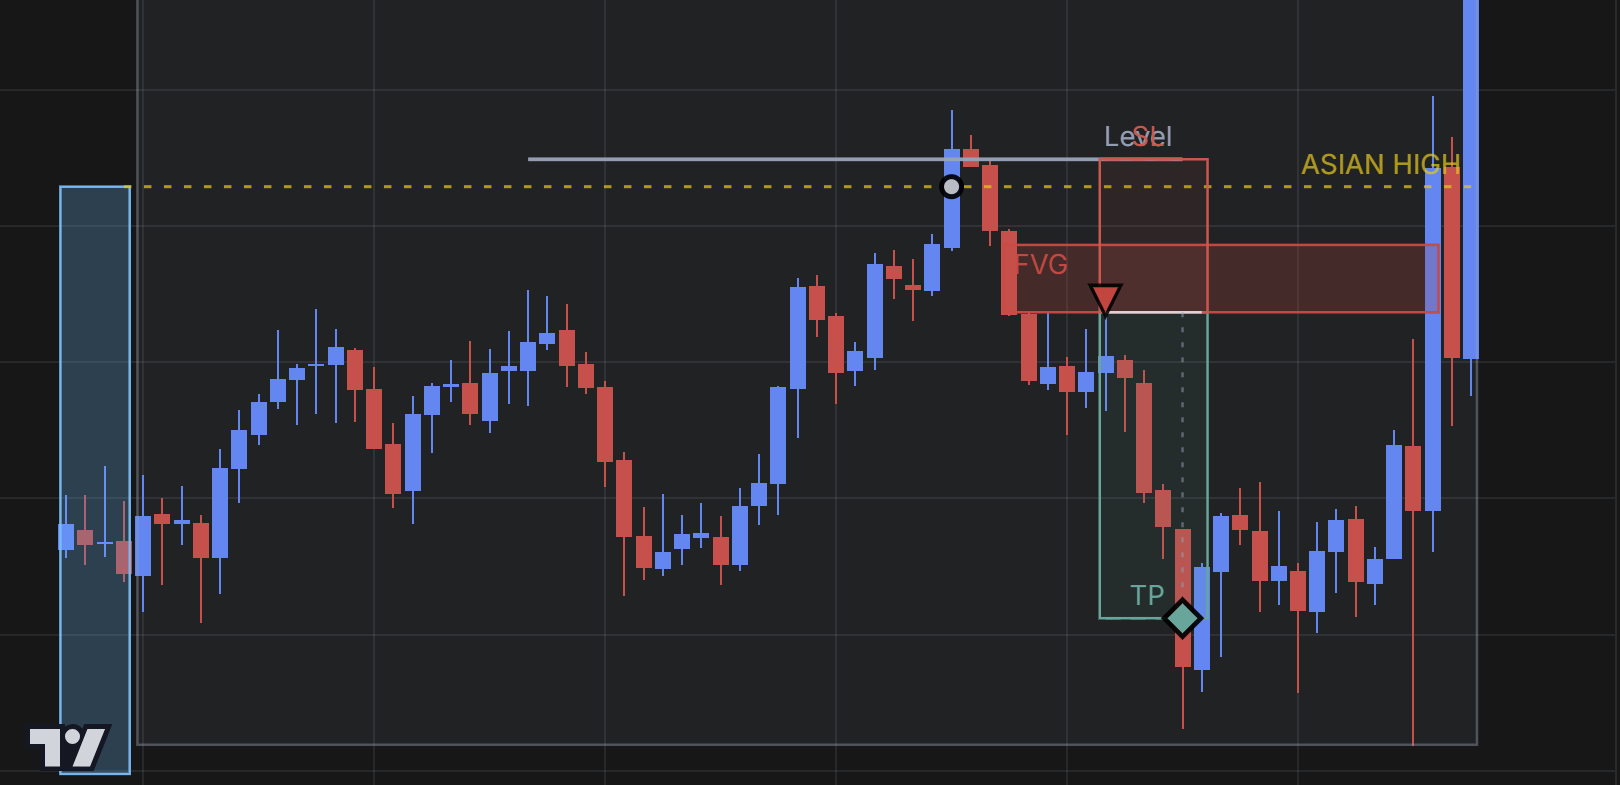
Always verify the behavior before trusting the results.
Watch Out for Look Ahead Bias
One of the most serious backtesting errors is look ahead bias.
It occurs when a strategy uses information that would not have been available at the moment a trading decision was made.
For example, suppose your strategy uses a four hour trend filter while entering on a 15 minute chart.
At 10:15, the final closing price of a four hour candle that ends at 12:00 is not yet known.
If the backtest uses that future closing price to make a decision at 10:15, the results contain information that would have been unavailable in live trading.
Similar problems can occur with swing point confirmation, indicators that recalculate historical values, and incorrectly aligned datasets.
A reliable backtest must respect the chronological availability of information.
Step 5: Understand What the Results Actually Mean
After verifying the trade logic, you can evaluate the strategy's performance.
This is where many traders make the mistake of focusing on one attractive number.
A high win rate, large total return, or smooth equity curve may look impressive, but none of these metrics is sufficient on its own.
Win Rate and Expectancy
Win rate measures the percentage of trades that were profitable.
However, profitability depends on both the frequency and size of winning and losing trades.
Consider a strategy that wins 80 percent of the time.
If its average winning trade earns $20 and its average losing trade costs $100, the expected result is negative.
Across 100 hypothetical trades, 80 winners would generate $1,600, while 20 losers would lose $2,000.
The strategy would lose $400 before additional trading costs.
Now consider a different strategy with a 45 percent win rate, an average winning trade of $150, and an average losing trade of $75.
Across 100 hypothetical trades, the winners would generate $6,750 while the losers would lose $4,125.
That produces a positive result of $2,625 before costs.
These are simplified examples, but they illustrate why win rate alone tells you very little about a strategy's profitability.
The more informative concept is expectancy, which estimates the average profit or loss per trade.
Maximum Drawdown
Maximum drawdown measures the largest historical decline from an equity peak to a subsequent trough.
Suppose a strategy grows a simulated account from $10,000 to $15,000 before declining to $10,500.
The decline from $15,000 to $10,500 represents a 30 percent drawdown.
Even if the strategy eventually recovers, that decline matters.
A large drawdown can make a strategy difficult to trade and may violate the risk limits of certain trading accounts.
Drawdown should therefore be evaluated alongside returns rather than treated as a secondary statistic.
Profit Factor
Profit factor compares gross trading profits with gross trading losses.
If a strategy generates $12,000 in gross profits and $8,000 in gross losses, its profit factor is 1.5.
A value above one means that gross profits exceeded gross losses over the historical sample.
However, a high profit factor based on only a few trades may provide limited evidence about future performance.
Trade Count and Statistical Confidence
The number of trades matters because small samples can produce misleading results.
A strategy that generated 12 profitable trades over several years has not necessarily demonstrated a reliable advantage.
However, a large trade count is not a guarantee of statistical significance either.
Trades may be correlated, market conditions may change, and repeated optimization can distort the apparent strength of the results.
The goal is to evaluate the quality of the evidence, not simply to collect impressive performance metrics.
Step 6: Check Whether the Strategy Is Overfitted
A strategy can perform extremely well on historical data and still fail when exposed to new market conditions.
One common reason is overfitting.
Overfitting occurs when a strategy becomes too closely adapted to the particular historical dataset used during development.
Imagine optimizing an RSI based strategy by testing hundreds of combinations of indicator periods, entry thresholds, stop loss distances, and trading sessions.
Eventually, some combinations may produce excellent results simply because they happen to match random patterns in the data.
Selecting the best historical combination does not mean you've discovered a repeatable market advantage.
This is why strategy validation matters.
Out of Sample Testing
One approach is to separate historical data into development and evaluation periods.
You use the first period to build and optimize the strategy.
Then you evaluate the selected configuration on data that was not used during development.
For example, you might develop a strategy using data from 2015 through 2020 and evaluate it on data from 2021 through 2023.
A later period could be reserved for a final evaluation.
If the strategy performs well only on the development data, that may indicate overfitting or changing market conditions.
It's important not to repeatedly modify the strategy after examining the evaluation results, because doing so gradually turns the evaluation period into additional development data.
Walk Forward Optimization
Walk Forward Optimization provides a more systematic way to evaluate parameter stability over time.
Instead of using one fixed development and evaluation split, the process repeatedly optimizes a strategy on an earlier historical window and evaluates it on a subsequent period.
For example, a strategy could be optimized using data from 2016 through 2018 and evaluated on 2019.
The window then moves forward, and the process repeats using later data.
Algovex includes Walk Forward Optimization as part of its advanced testing capabilities.
This can help investigate whether a strategy continues to perform when its parameters are selected using earlier market conditions.
However, Walk Forward Optimization does not eliminate overfitting entirely. The overall research process still needs to be designed carefully.
Step 7: Test the Strategy Under Different Conditions
A strategy that performs well under one set of assumptions may behave very differently when those assumptions change.
That's why robustness testing is an important part of systematic trading research.
One useful approach is to change individual parameters slightly and observe how sensitive the results are.
For example, suppose a breakout strategy performs well with a 20 candle lookback period.
What happens if you use 18 or 22 candles instead?
If the results deteriorate dramatically after a small change, the strategy may depend on a very specific historical configuration.
You can also test how the strategy behaves when trading costs increase.
A system that becomes unprofitable after a small increase in spread or slippage may have limited room for execution uncertainty.
Evaluate Different Market Environments
Markets do not behave consistently over time.
Trend following strategies may perform well during sustained directional movements and struggle during sideways conditions.
Mean reversion strategies may experience significant losses during strong trends or sudden volatility expansions.
Evaluating different market regimes can help reveal these dependencies.
The objective is not to find one market environment where the strategy looks excellent.
It's to understand when and why the strategy behaves differently.
Portfolio Backtesting
If you intend to trade multiple strategies, evaluating each one individually is not enough.
Two strategies may both have attractive historical results while experiencing their largest losses during the same market conditions.
Combining them could therefore create more risk than expected.
Portfolio Backtesting allows traders to evaluate the historical behavior of multiple strategies together.
Algovex includes portfolio testing capabilities for this purpose.
Extreme Market Scenarios
Historical datasets cannot contain every possible future market event.
However, stress testing can help investigate how a strategy might behave under extreme conditions.
Algovex includes Black Swan Backtesting for examining strategy behavior under stressed market scenarios.
The usefulness of such tests depends on the scenarios and assumptions used. They cannot predict every possible market disruption.
Prop Firm Simulation
Strategies intended for proprietary trading environments face additional constraints.
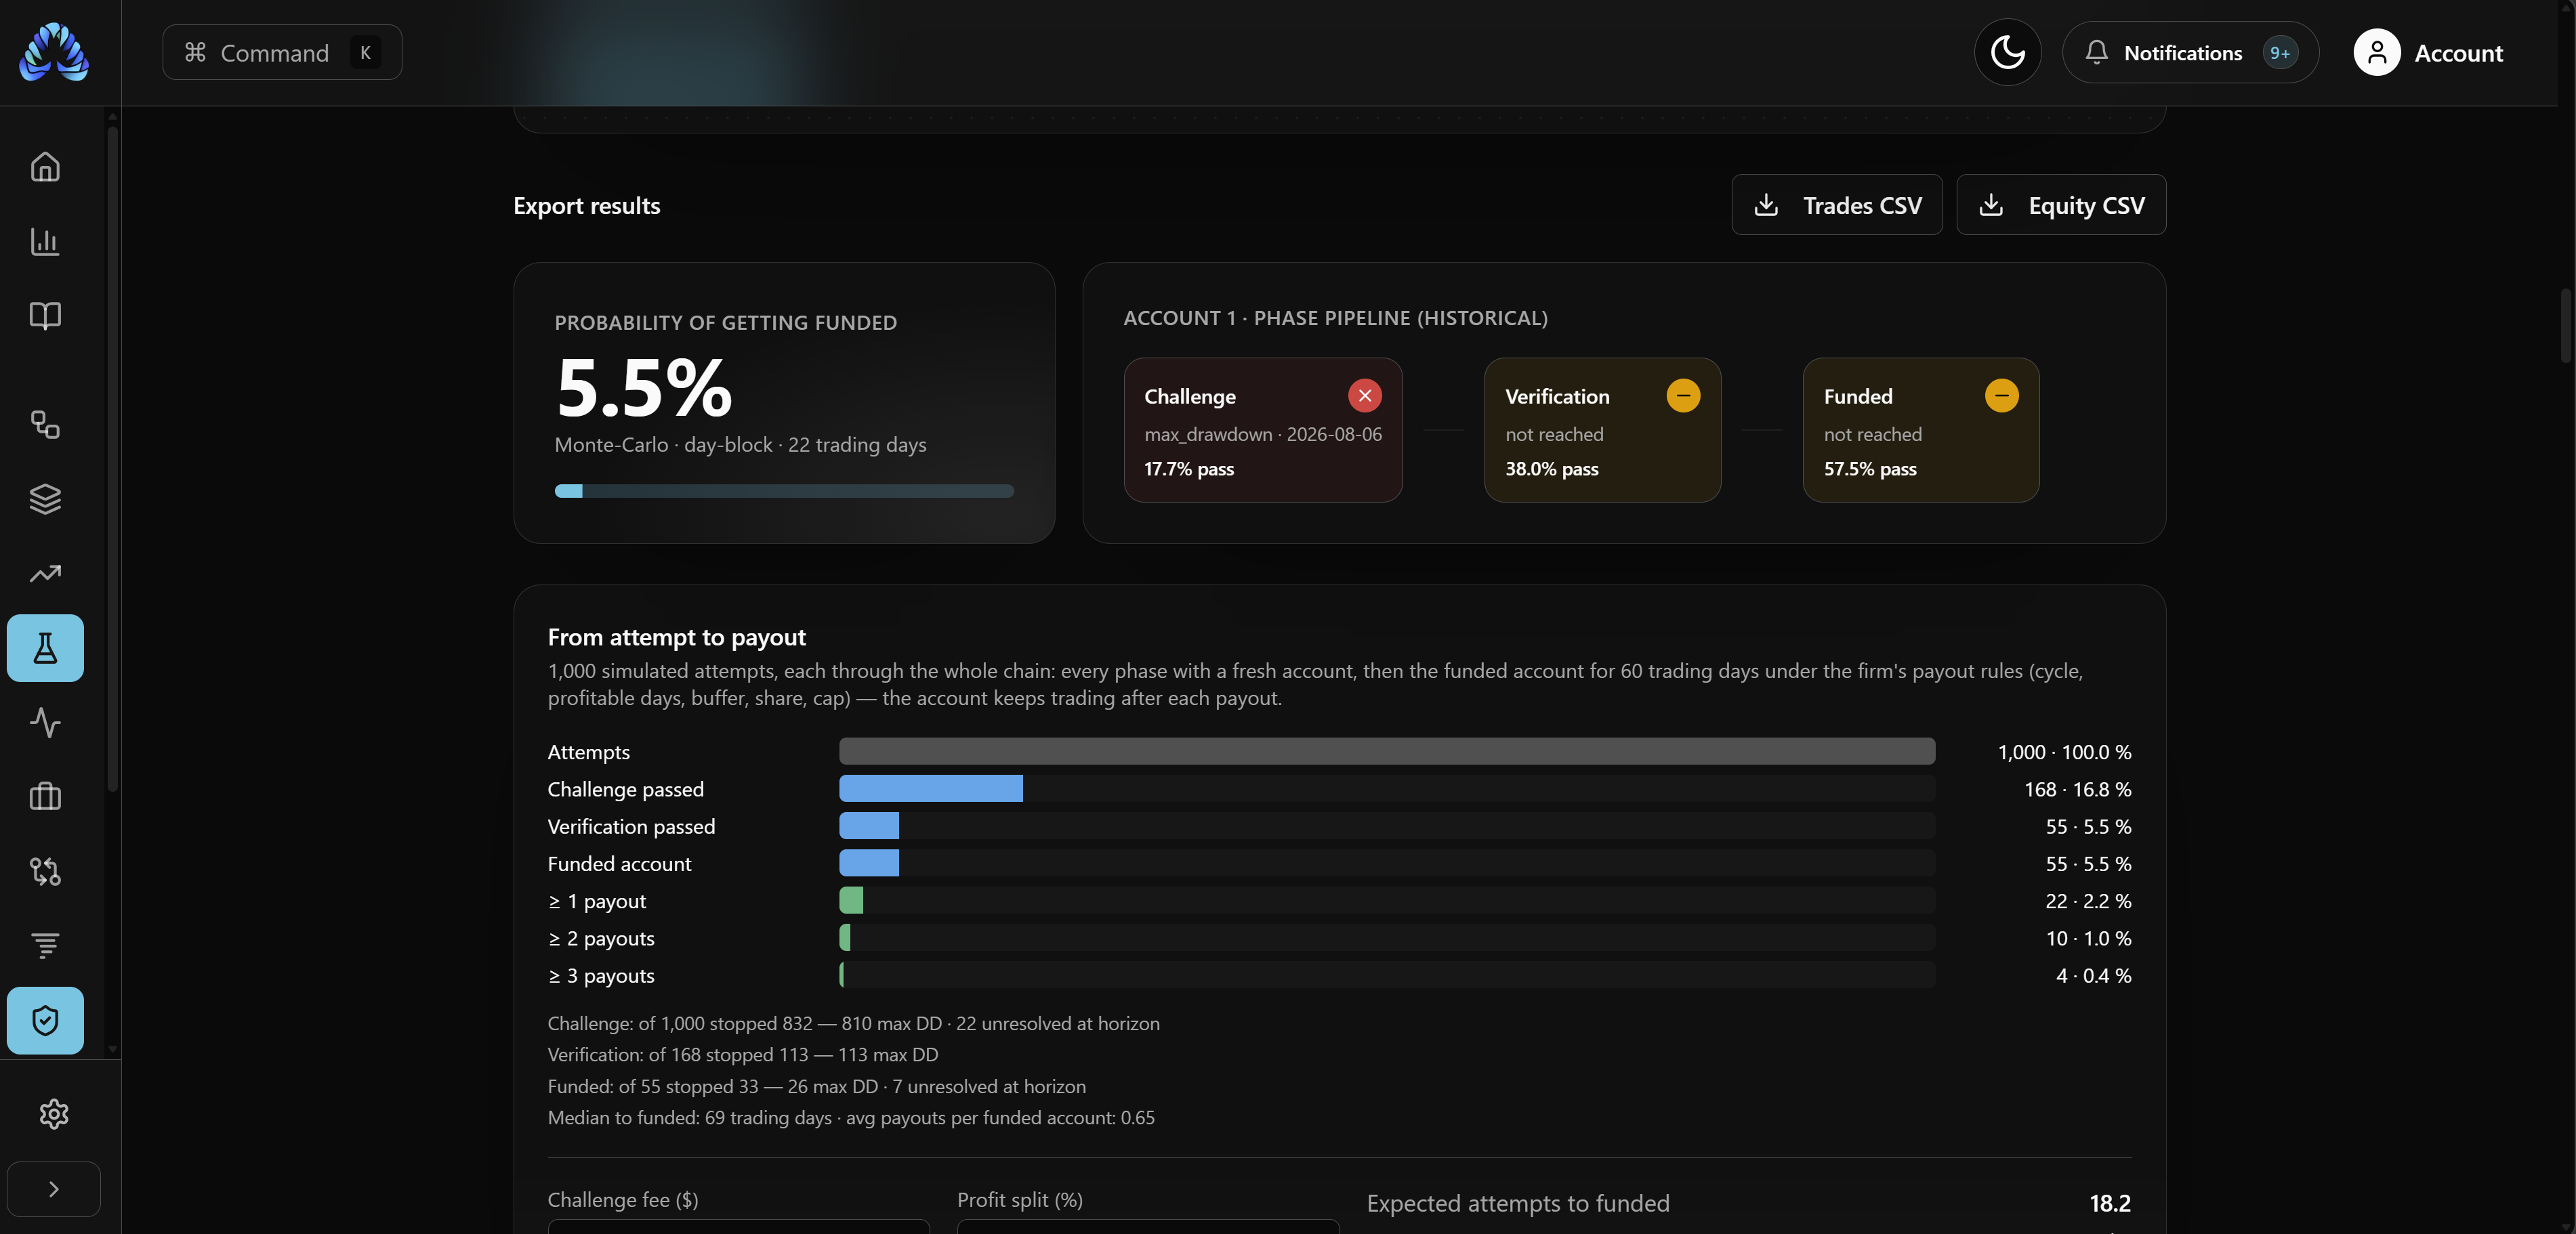
A strategy might generate positive historical returns while violating a simulated maximum drawdown limit or another challenge rule.
Algovex provides Prop Firm Simulation to help evaluate strategies under modeled trading account restrictions.
These tests can be useful when investigating whether a strategy is compatible with a particular risk framework.
Step 8: Move From Historical Testing to Forward Testing
Even a strategy that performs well across multiple historical tests has not demonstrated that it will remain profitable in the future.
The next step is often forward testing.
Forward testing means evaluating a strategy on newly arriving market data without changing its rules in response to every new result.
Unlike historical backtesting, where all market data already exists, forward testing allows you to observe how the strategy behaves as new market conditions unfold.
This is particularly useful for identifying differences between historical simulations and real market behavior.
Final Thoughts: Start Testing Your Trading Ideas
Backtesting doesn't require programming knowledge, but it does require clearly defined rules, appropriate historical data, and realistic expectations.
A reliable backtesting process involves more than finding profitable historical results. It means understanding why trades occurred, accounting for trading costs, evaluating risk, and testing whether a strategy remains robust under changing conditions.
Modern no-code tools make this process more accessible by allowing traders to focus on strategy development rather than programming.
With Algovex, you can build rule-based strategies visually, evaluate them using historical market data, and explore their behavior through detailed performance analysis.
Ready to test your own trading idea?
Explore Algovex and start building your first trading strategy without writing code.