Chart Extraction
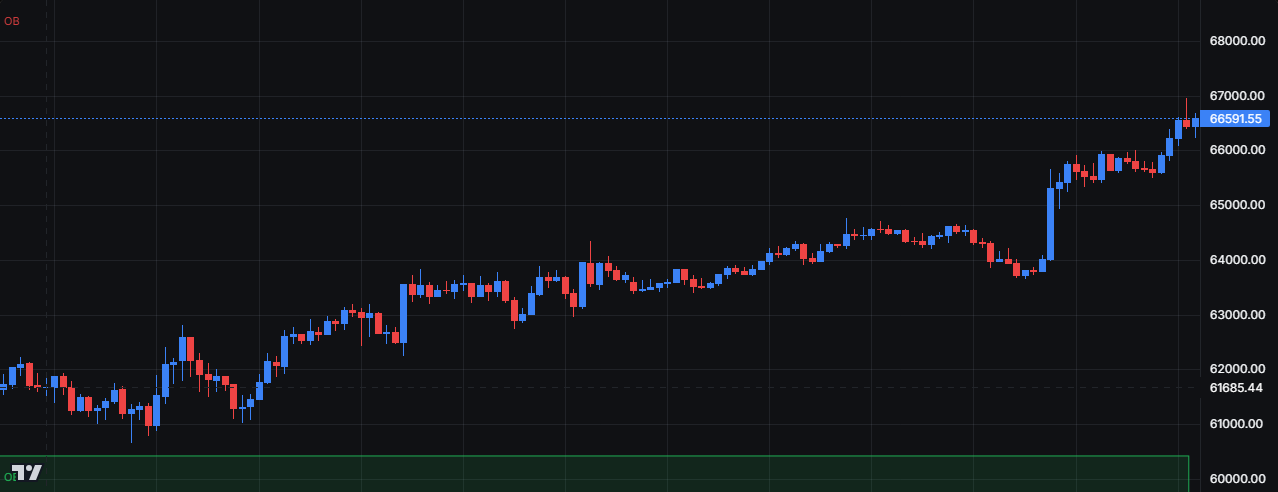
Render the exact chart your strategy produces (candles, indicator overlays, and every entry/exit marker) straight from your node graph. It's the fastest way to see what your strategy actually did, bar by bar.
What it does
Chart Extraction runs your compiled strategy over historical data and draws the result: the price series, the indicators and zones your nodes output, and the trades the logic took. Because it uses the same engine as the backtester, what you see is what the strategy genuinely evaluated, not a mock-up.
Real marks, real trades
Entries, exits, stop-loss and take-profit levels are drawn where the strategy actually placed them, with the conditions that triggered each one.
Visual proof
See whether your levels land where a trader would draw them and whether signals fire on the right bars, invaluable for debugging a strategy.
Multiple chart modes
Candlestick charts with oscillator panes today. Footprint and heatmap views for order-flow strategies are coming (no date).
Running an extraction
- Open a strategy in the visual editor.
- Open the Chart Extraction panel and pick a symbol and timeframe.
- Set how many trades to scan for, then run; the engine scans data until it finds that many fully executed trades.
- Inspect the rendered chart; optionally download it as a PNG.
Monthly limits by plan
Each run counts as one chart extraction. The monthly allowance depends on your plan; the editor shows how many you have left this month.
| Plan | Chart extractions |
|---|---|
| Free | 5 / month |
| Pro | Unlimited |