Volume Profile Nodes
Volume-by-price tools that show where business actually got done: Point of Control, value areas, developing value, and the unfinished levels price tends to revisit. Built on OHLCV volume, available for every supported symbol.
Node families
Volume Profile
Builds the histogram of traded volume by price for a session or period, and surfaces the Point of Control (POC) and the Value Area (VAH/VAL) where most activity occurred.
POC · VAH · VALDeveloping Value
Tracks POC and the value area as they evolve through the current session, drawn as a developing line so you can see where value is building in real time.
developing POC / VAValue-Area Migration
Compares value areas across sessions to classify inside/outside days and flag when value migrates up or down, a Dalton-style read on market acceptance.
VA migrationProfile Shape
Classifies the session profile (D-shape, P, b, double-distribution, thin) so a strategy can react to balance vs imbalance.
D / P / b / double / thinNaked POC (coming later)
Not available at launch. Will find prior POCs that price has not yet returned to (common magnets for future price) and track tag / reject / accept events.
naked POC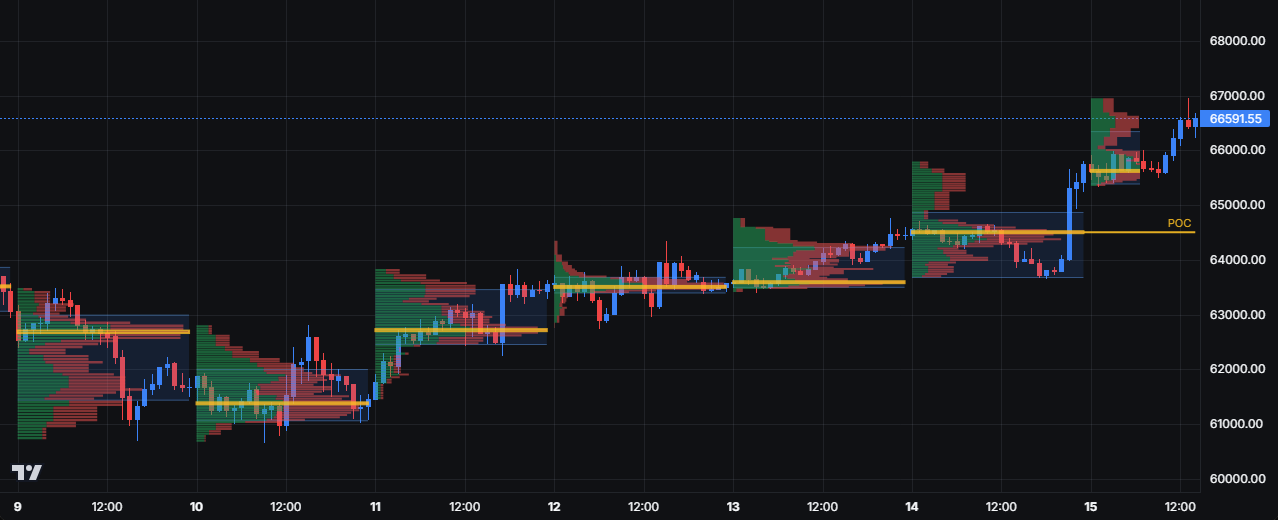
How it's drawn
Volume Profile nodes render the actual histogram plus the POC and value-area levels. Prior sessions show locked levels; the current session shows developing value that updates bar by bar, so the chart reads the way a profile trader would draw it, not as a moving average.
Session-aware
Profiles are scoped to a session or period rather than smeared across the whole series, so value areas mean what they should.
Trigger on the settled profile
Shape and migration signals fire on the completed period's settled profile, not on every intrabar tick, for fewer false reads.